alt-history tech idea: svg web pages
Firstly, succumb to the knowledge that SVG files can have javascript embedded in them. Here is an example of some SVG art I made with a color-picker built into it.
Secondly, a fun fact: In SVG, a block of javascript code can live inside a tag alongside vector graphics. This means if you copy that group to another SVG document (e.g. in inkscape) the script will come along too.
So consider: an alternate history where SVG won over HTML. One where someone wrote some javascript that dynamically resizes the SVG viewbox depending on display resolution, and implements a grid-based layout system. I'm 50% sure this is possible, someone would just have to implement it.
So given paragraph 1, 2, and 3 together: I'm imagining that you could distribute scripts for SVG web pages as fancy vector graphics with the javascript inside its group tag. So if you were to load one of these alternate universe web pages into a graphics editor, you'd be able to see all the libraries it uses arranged in a neat row just outside the canvas extents.
 Anyway, I just think that would be neat
using svg with javascript to generate a mini metro map
@blackle’s post reminds me of an old project. i made a mini metro map for perth, australia, but the source code is actually an svg drawing that uses an embedded script to generate the map in the format the game expects: https://bucket.daz.cat/mmm/per/drawing.svg
maps for this minimalist rail transit strategy game are in a json-based format, and include the visible geometry of land masses and water bodies, plus invisible geometry for things like the regions that stations can spawn in. there’s no level editor available to the public though, so the official guide suggests the following workflow:
- draw or trace your map geometry in inkscape
- save it as a svg file, then reopen in a text editor
- for each path,
- convert the svg path data to absolute points
- for each point, negate all of the y coordinates
- paste the result into your city.json where needed
that first step is ok, but the rest are
what if we could use coding and algorithms to solve these problems without doing a bunch of tedious and error-prone conversions by hand?
let’s add a script and textarea field to the end of the svg element. the textarea element is from html, so we need to wrap it in a foreignObject.
<svg ...>
  ...
  <foreignObject width="74vw" height="60vh" x="13vw" y="13vh">
    <xhtml:textarea id="out" style="width:100%;height:100%" />
  </foreignObject>
  <script href="drawing.js" />
</svg>we can make a variable containing most of our city.json, with holes where all of the geometry needs to go. these holes grab the relevant paths by id, and pass them to our convert function for conversion to absolute points.
const result = {
"customName": "Perth",
"customCountryName": "Australia",
"customLocalName": "Boorloo",
"customLocalNameLocale": "nys",
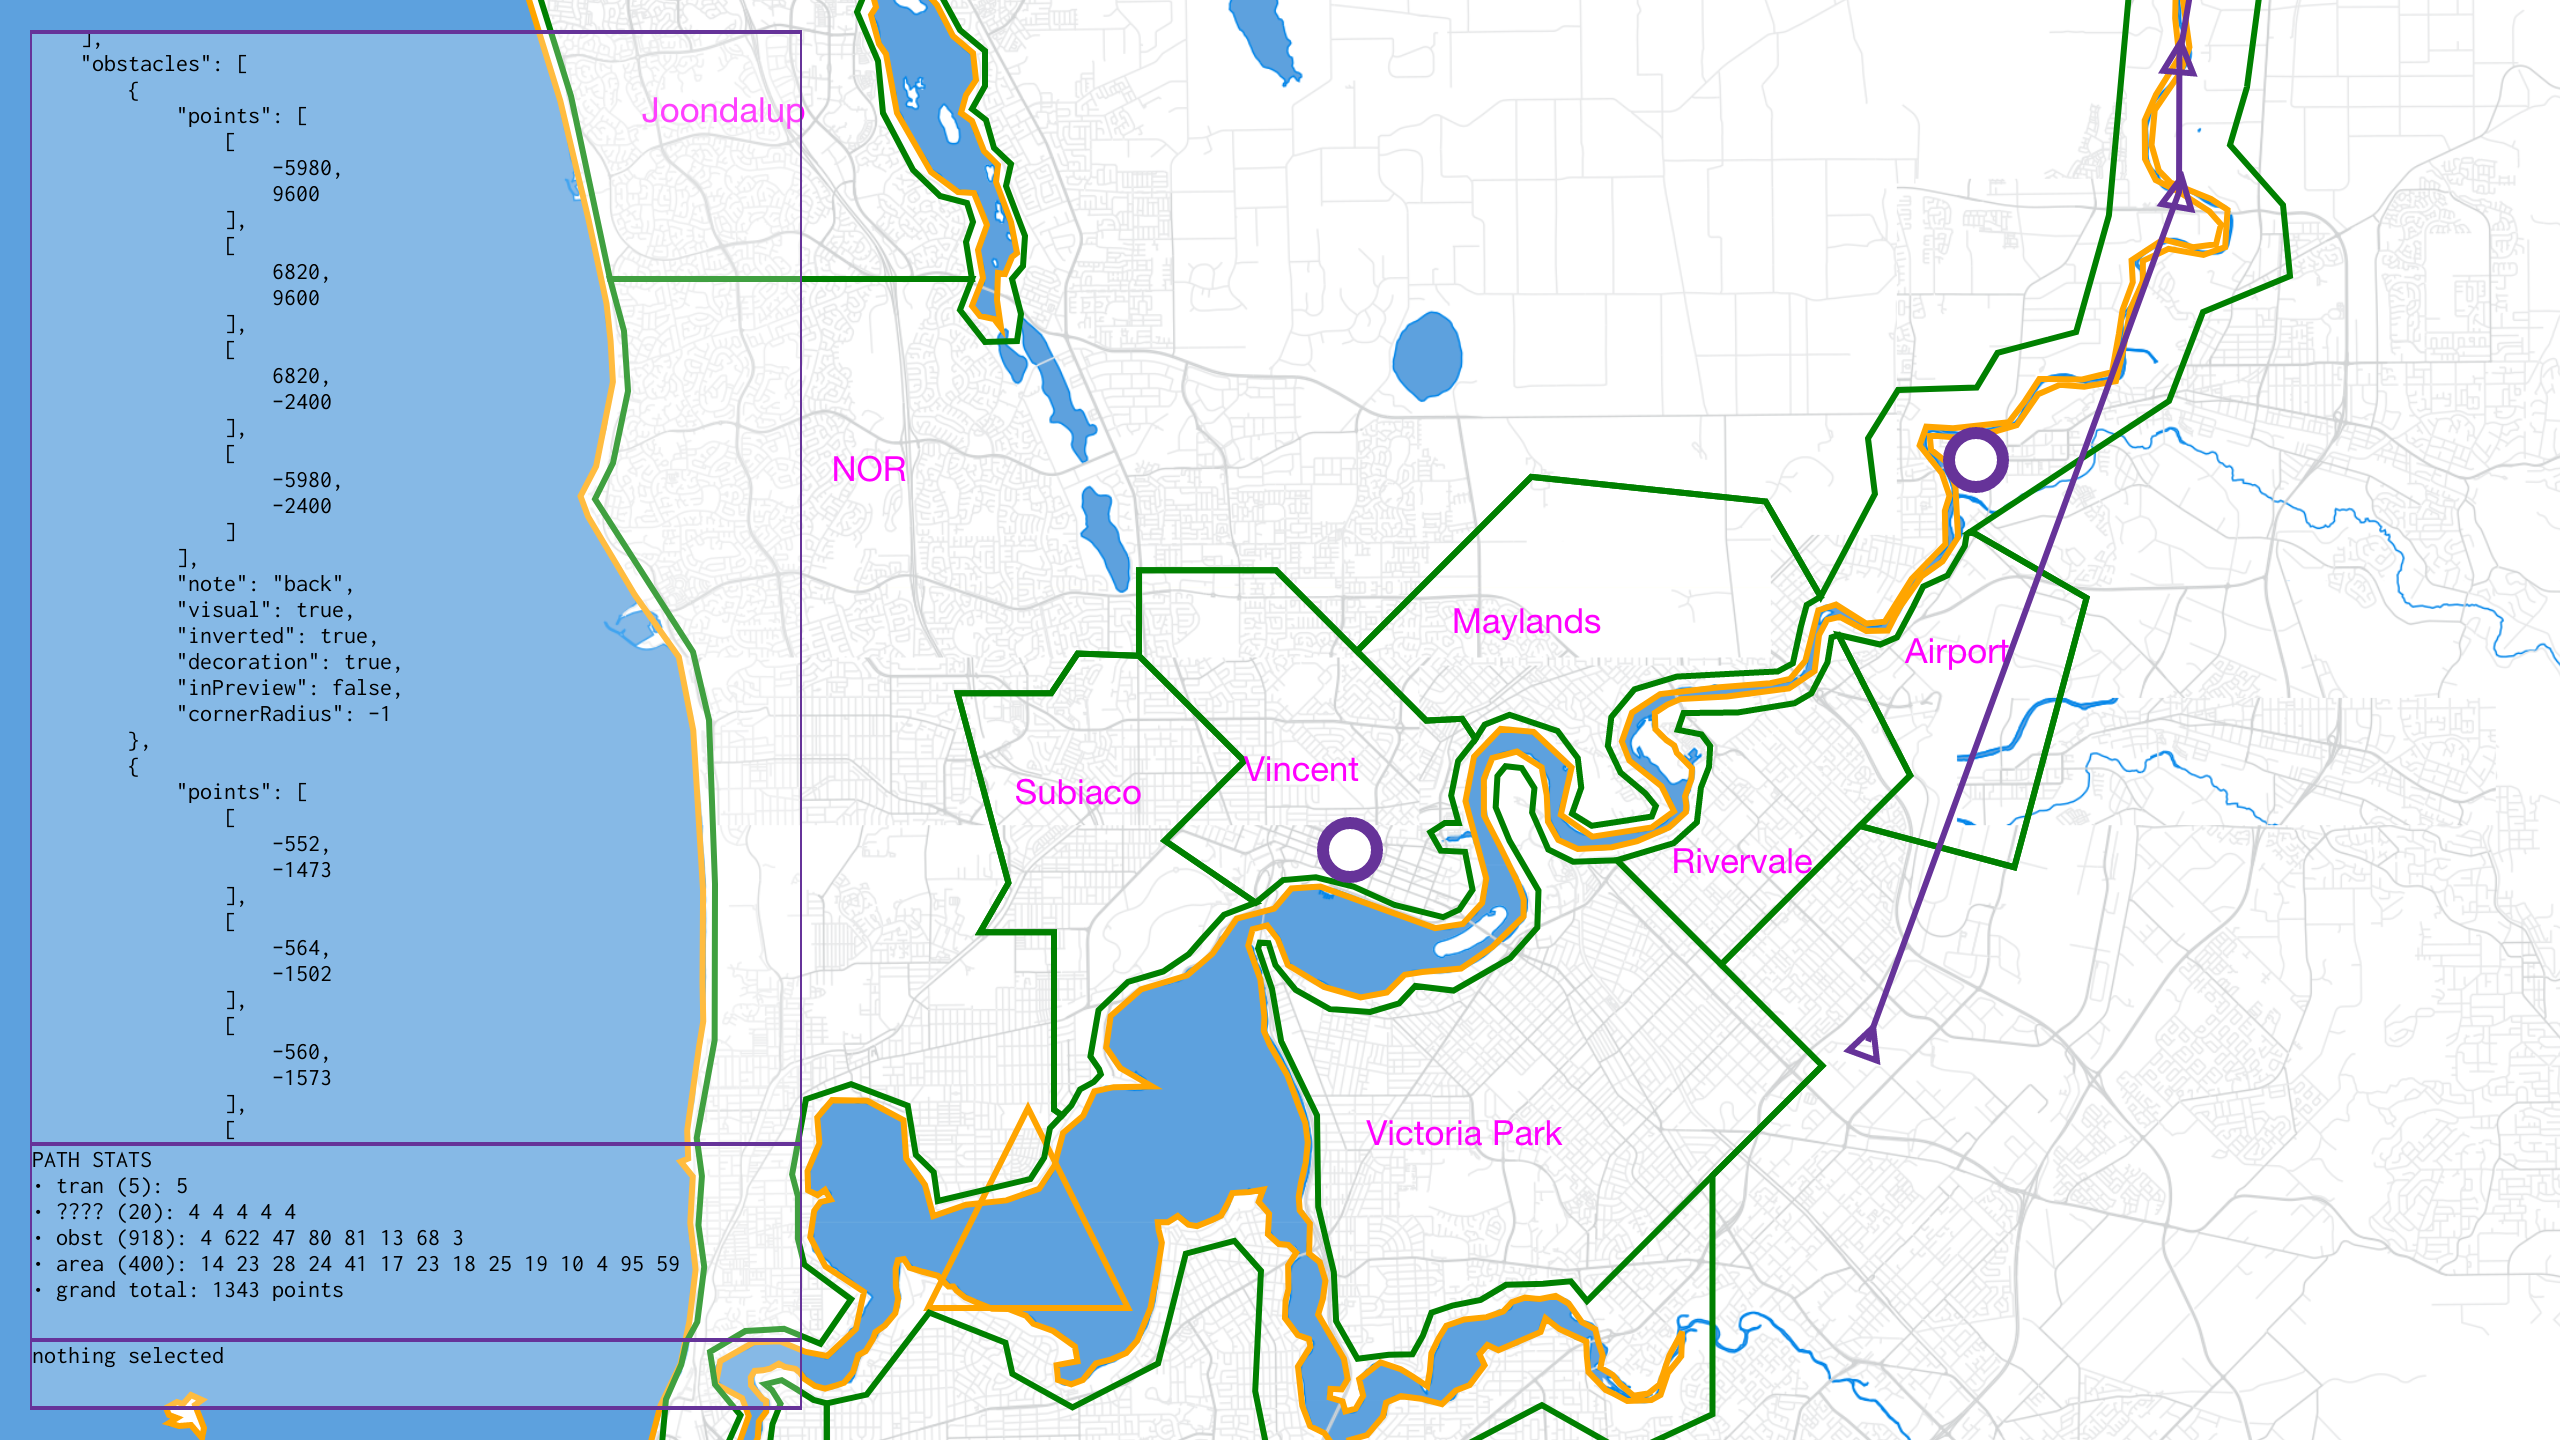
"obstacles": [
{
"points": convert("#back"),
"note": "back",
"visual": true,
"inverted": true
},
{
"points": convert("#swan"),
"note": "swan",
"visual": true,
"inverted": false
},
{
"points": convert("#lakejoondalup"),
"note": "Lake Joondalup",
"visual": true,
"inverted": false
}
],
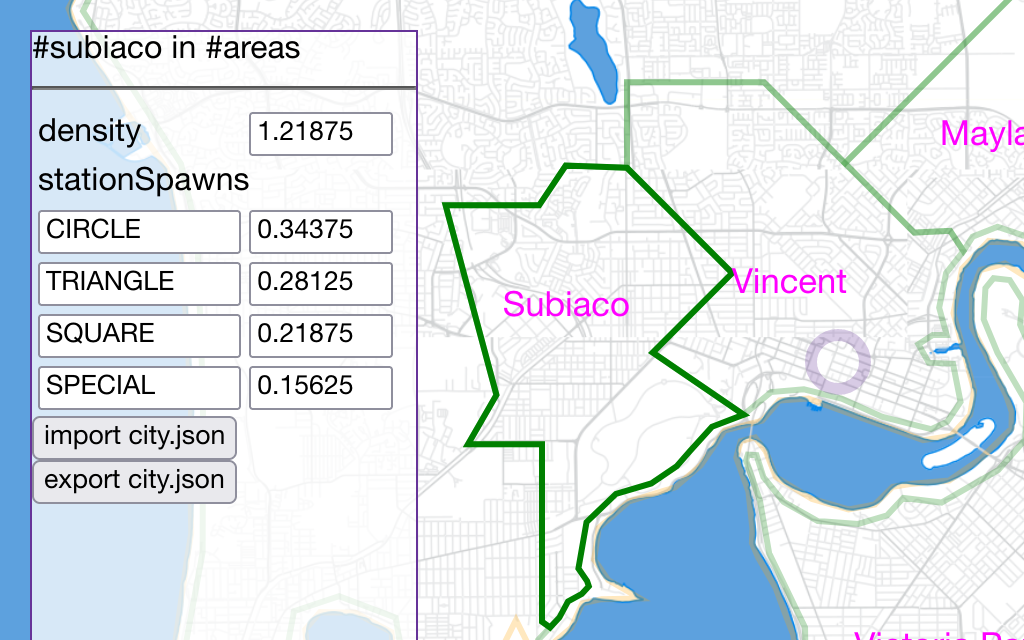
"cityAreas": [
{
"label": "Vincent",
"density": 1.25,
"paths": [ { "points": convert("#vincent") } ]
},
{
"label": "Maylands",
"density": 1.21875,
"paths": [ { "points": convert("#maylands") } ]
},
{
"label": "Subiaco",
"density": 1.1875,
"paths": [ { "points": convert("#subiaco") } ]
}
]
};the convert function walks through the pathSegList of the given path, adding or replacing coordinates as needed to make them absolute, then negating y for the result.
function convert(path) {
    const result = [];
    let prev = null;
    path = document.querySelector(path);
    for (const seg of [...path.pathSegList]) {
        const type = seg.pathSegTypeAsLetter;
        let next = type >= "a" ? [...prev] : [0, 0];
        switch (type) {
            case "Z": case "z":
                break;
            case "M": case "m":
            case "L": case "l":
                next[0] += seg.x;
                next[1] += seg.y;
                break;
            case "H": case "h":
                next[0] += seg.x;
                next[1] = prev[1];
                break;
            case "V": case "v":
                next[0] = prev[0];
                next[1] += seg.y;
                break;
            default:
                throw new Error(`unexpected path command type ${type}`);
        }
        if (prev == null || next[0] != prev[0] || next[1] != prev[1])
            result.push([next[0], -next[1]]);
        prev = next;
    }
    return result;
}now we can serialise the object into a complete mini metro map. we can later edit the geometry if needed, and inkscape will ignore (but keep) the foreignObject and the script, so any changes we make will be reflected in the output! yay!
document.querySelector("#out").value =
JSON.stringify(result, null, 4);what would a mini metro level editor look like?
it makes sense that there’s no dedicated level editor in the traditional sense. the devs have better things to do than reimplementing half of inkscape, which already does a good job of tracing geometry from maps.
but maybe the devs could make a “mini-metro-sdk.js” that you could plug into any drawing, open it in a browser, then build the rest of your city.json interactively, clicking on paths to configure them as game objects. imagine something like this: